Noise Inspection
Denoising is optional and based on your real-time observations and system behavior. Noise charts may be utilized to analyze the amount and characteristics of the noise generated by the system.
The noise charts would be a very helpful tool for selecting which filters to use, and deciding the parameters to set to the filters. See Denoiser for setting the filters.
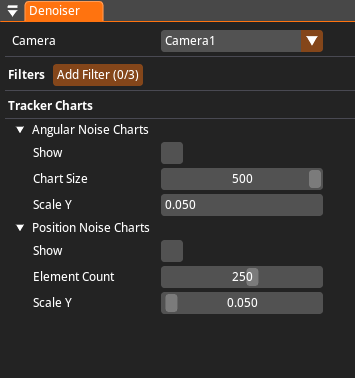
The noise charts can be shown and hidden via the Denoiser pane.

Angular vs Position Noise
There are two available noise charts:
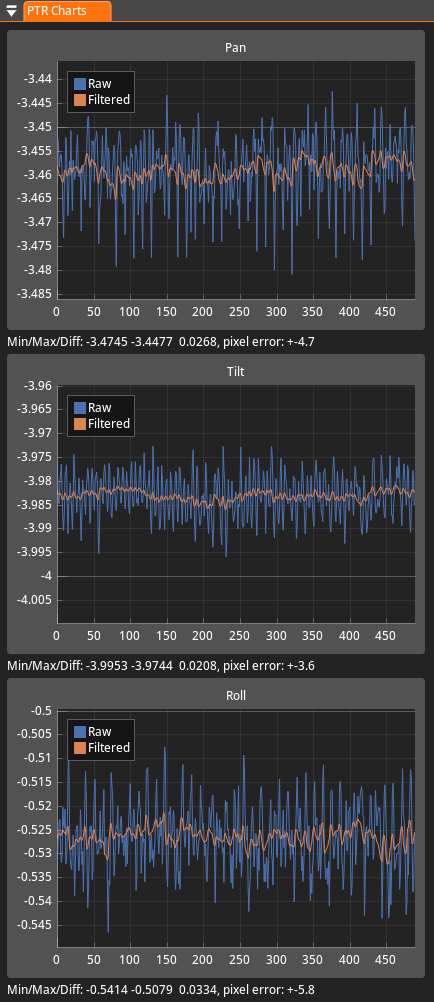
- Angular Noise Charts are for inspecting angular noise in the orientation of the tracked object, separately for pan, tilt, and roll.
- Position Noise Charts are for inspecting the positional noise in the location of the tracked object, separately for X, Y and Z.
In both charts, the original incoming data and the filtered/smoothed data are shown on the same graph.
Go to Tracker Charts, enable the Show option.

Pixel Error
One of the key indicators for noise is the 'pixel error' which is displayed in the bottom of each angle in the Angular Noise Chart. This value shows the effect (in pixels, assuming an HD resolution of 1920x1080) that the noise would move virtual objects on the final output.
Pixel error and its effect on perceived visual quality depend on many factors, therefore the application of denoising is very case-dependent.
For example, you can consider a scenario where the camera often zooms in on a talent.
- Pixel error is much higher when the camera zooms in an object.
- At the same time, in this case the virtual objects in the background are often out of focus and blurred
- As a result, the perceived noise could still be small.
- However if there are AR objects close to the talent, then zooming in on them would likely generate a higher perceived noise.